Graph Maker Online Free
Create graph designs easily with templates with Fotor's online graph maker. Import or input your data to integrate and visualize it in a couple of clicks. Easily make, share, download , or embed your graph.
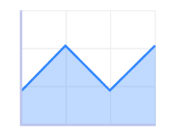
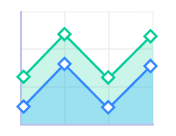
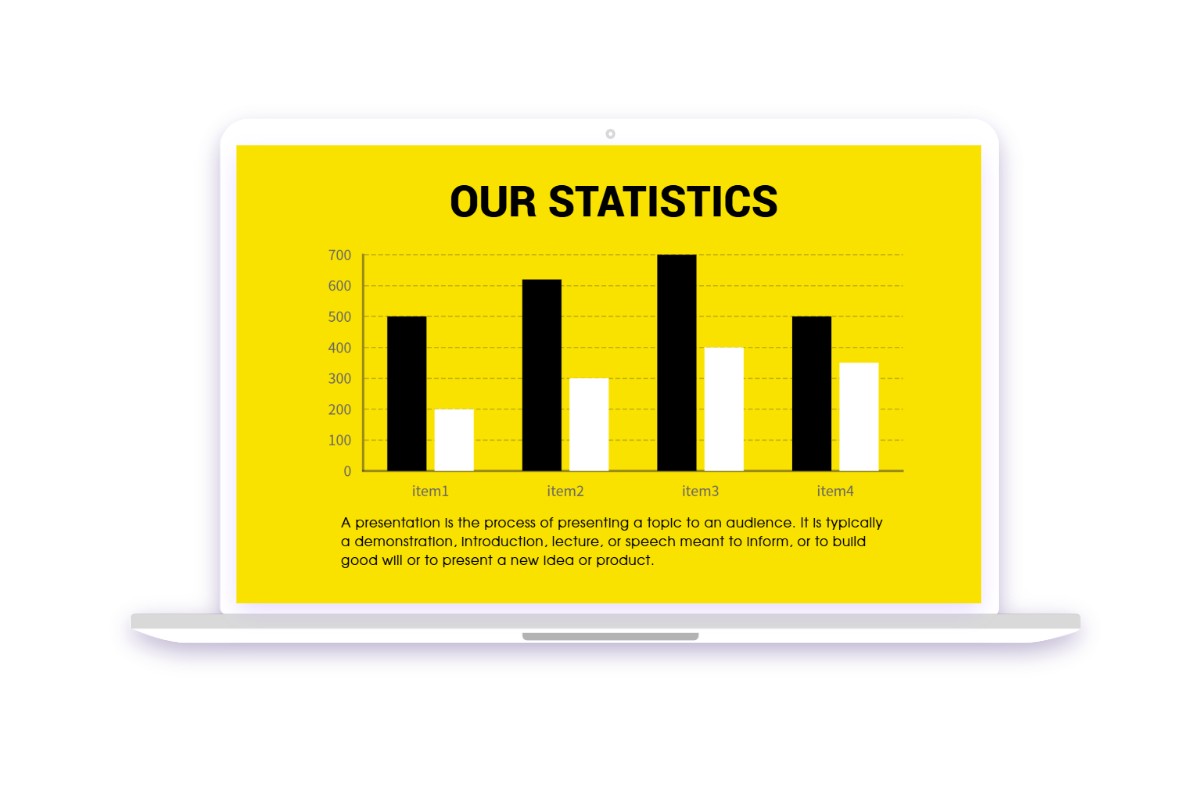
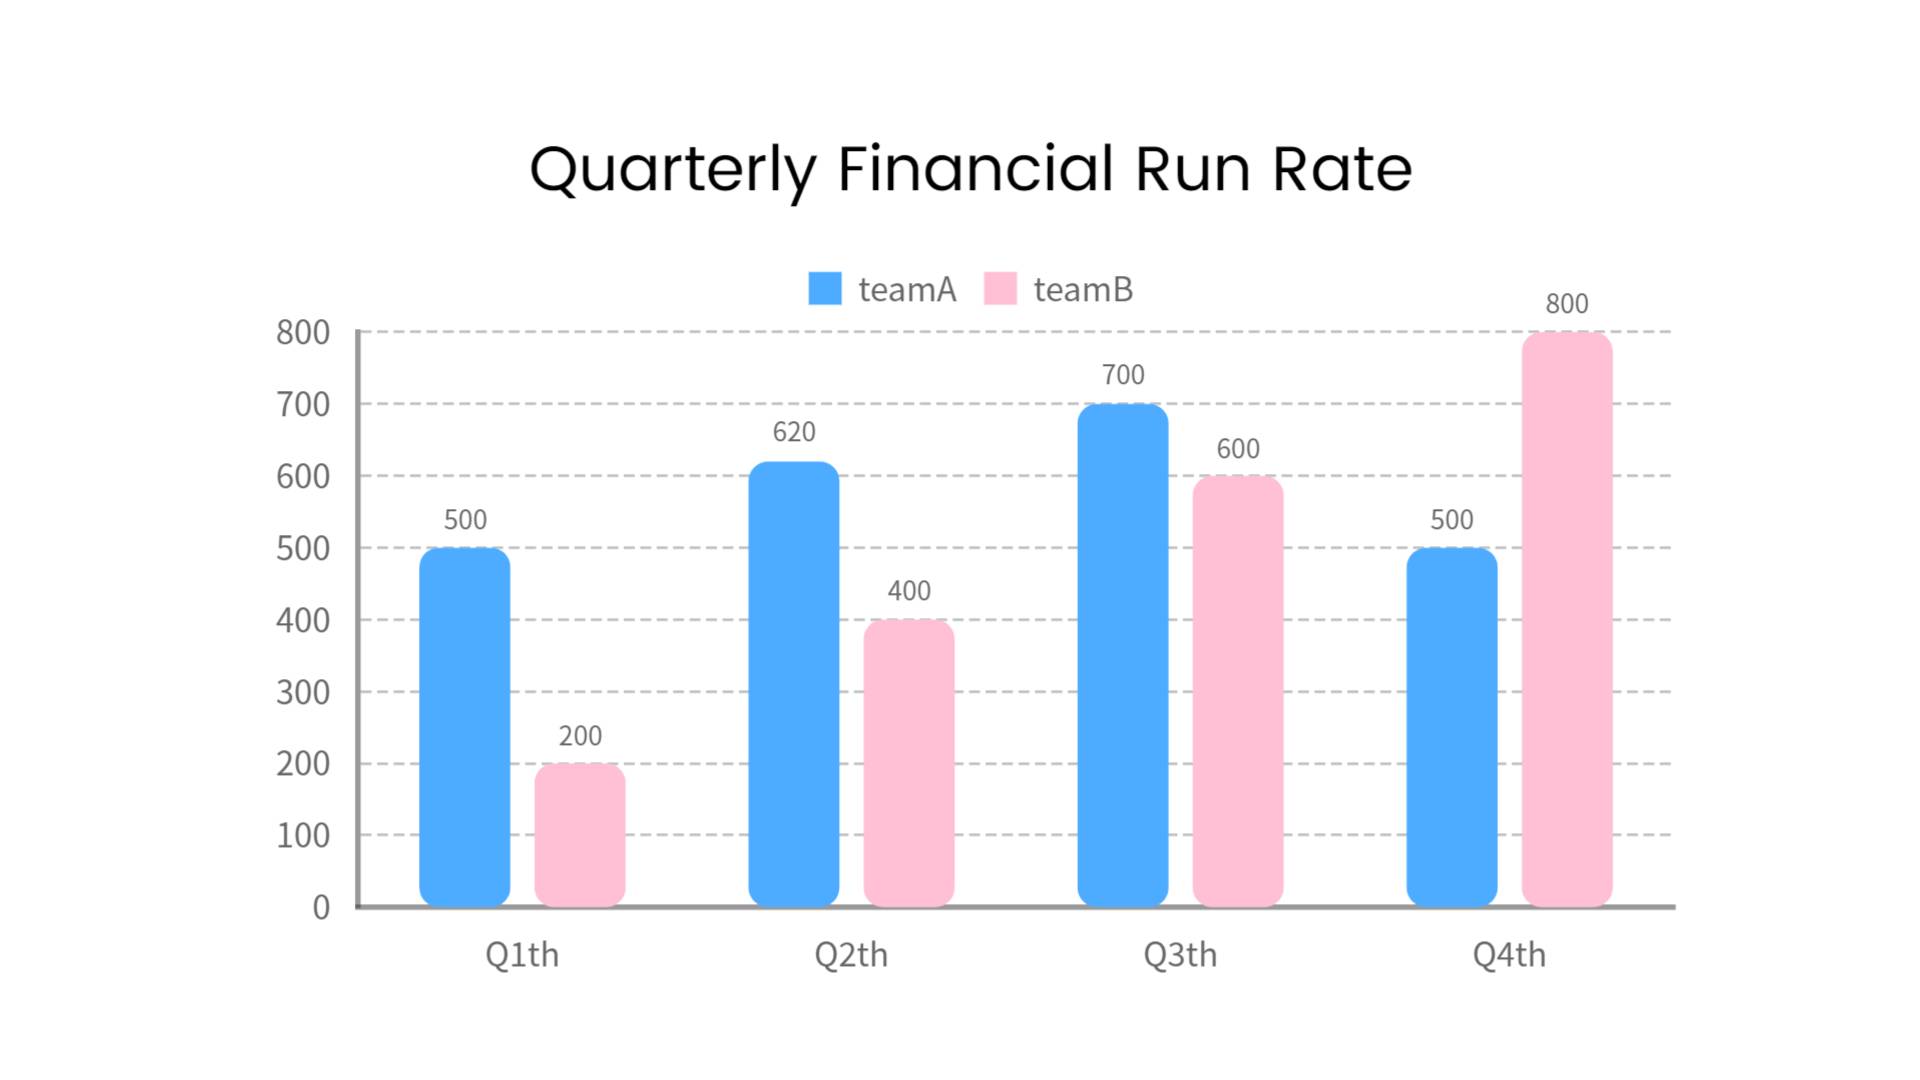
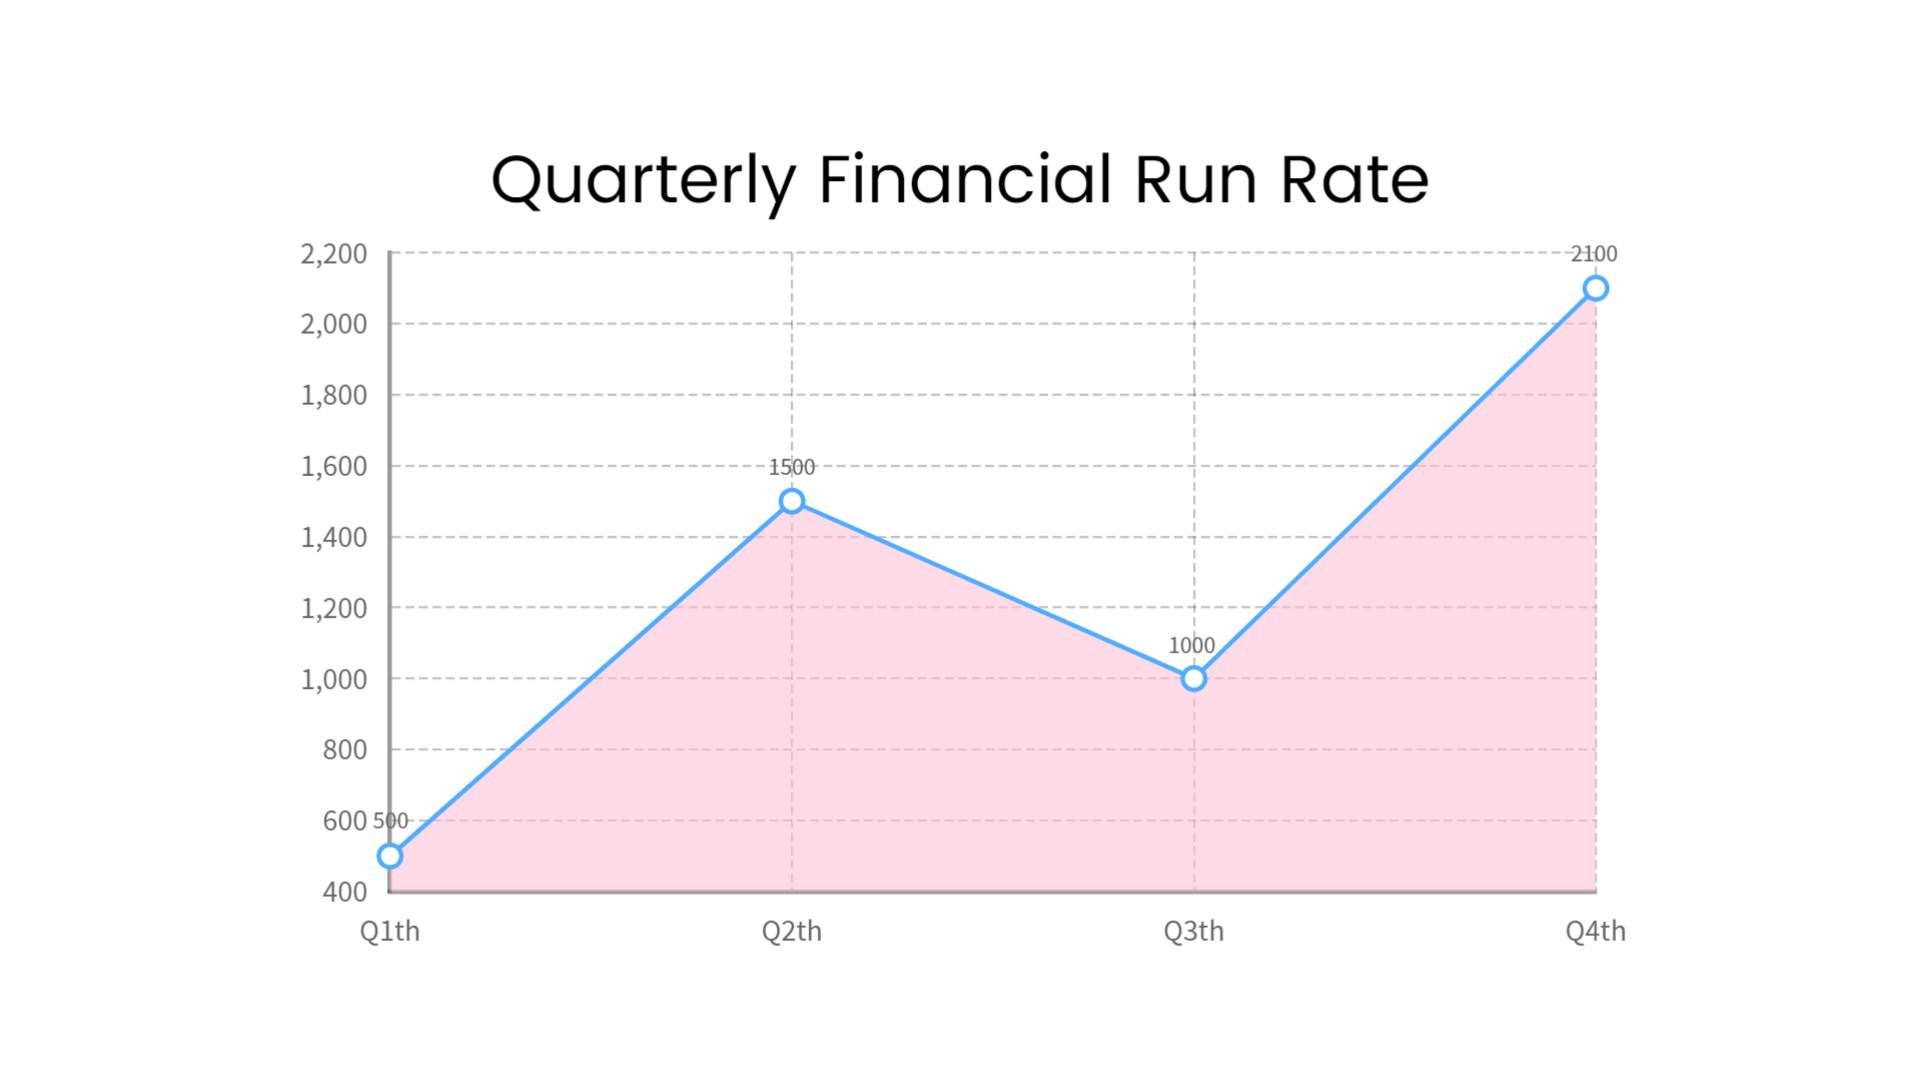
Types of Charts You Can Create with Fotor Graph Maker
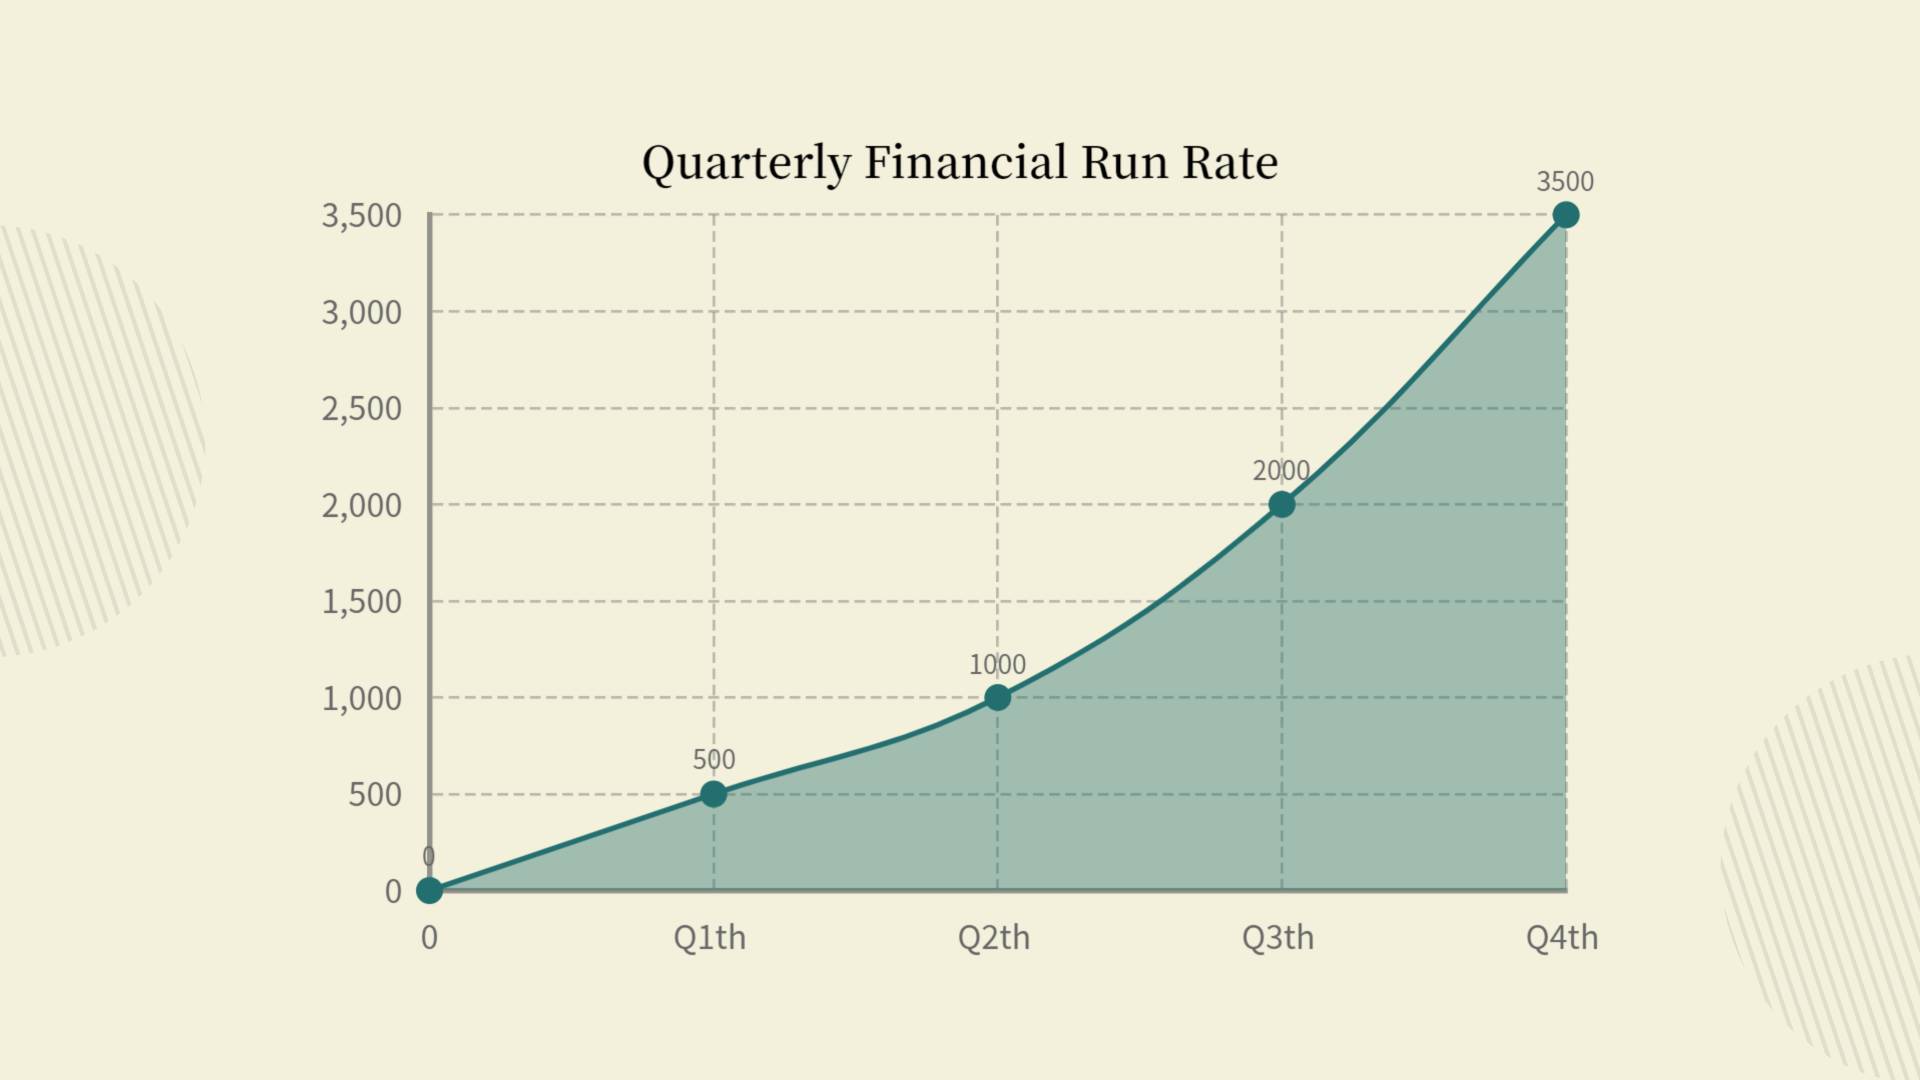
Preview the various chart types available in our graph chart maker. Utilize this tool for bar, line, pie, area graphs, and more. Select from a series of chart templates and instantly integrate your complicated data into a visualized, easy-to-understand graph.


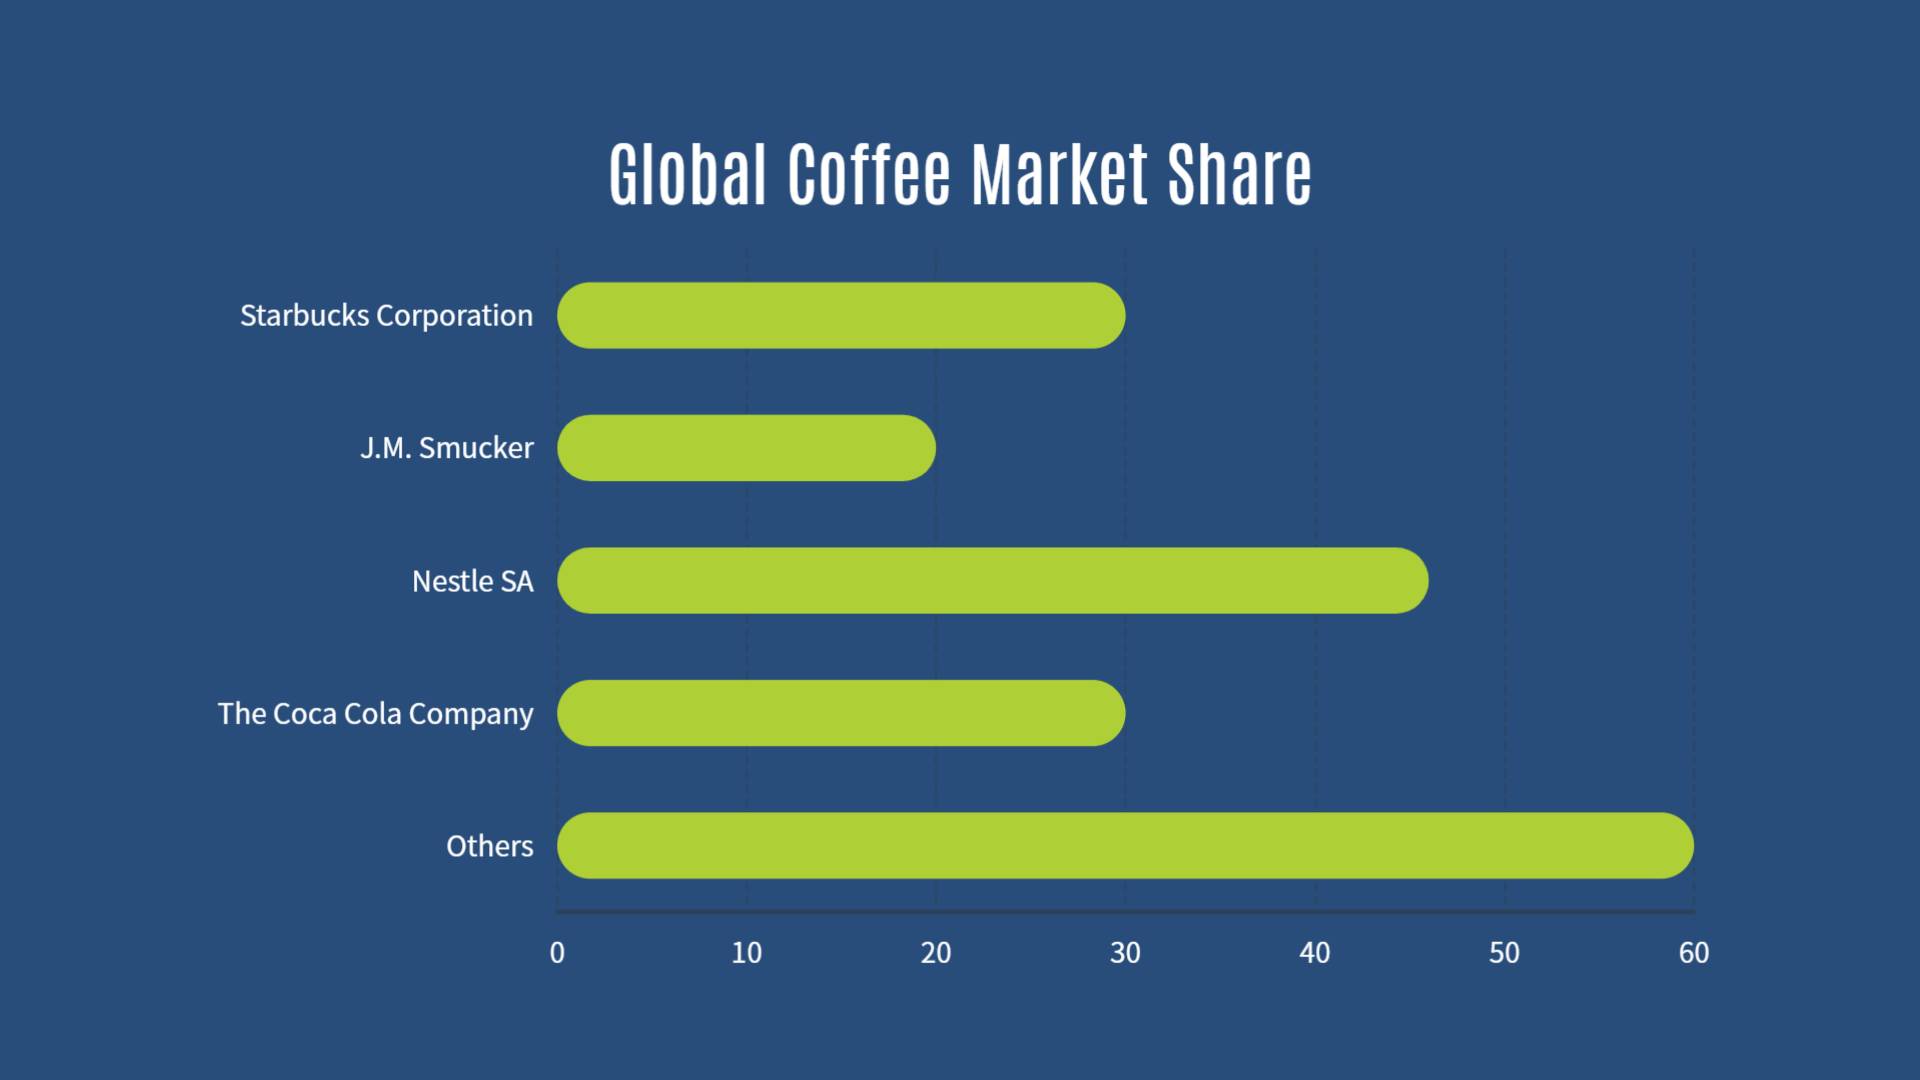
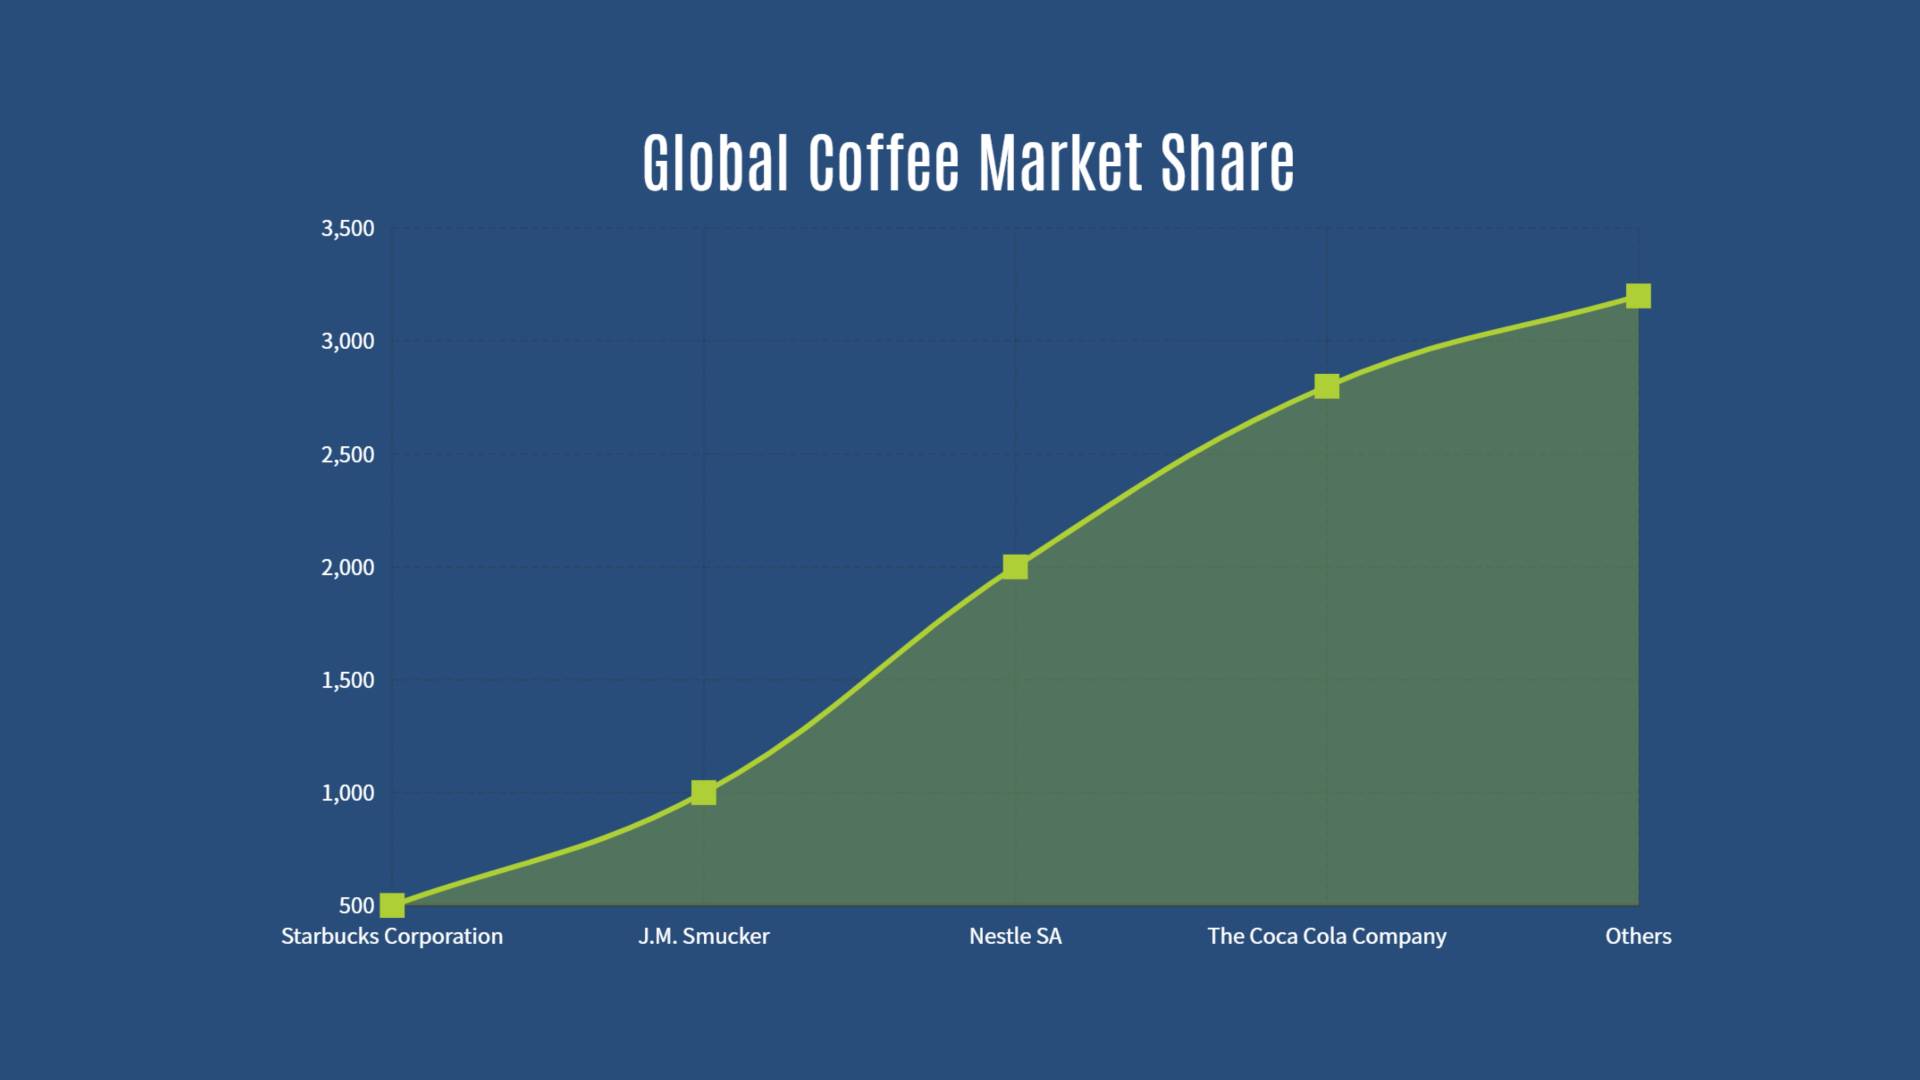
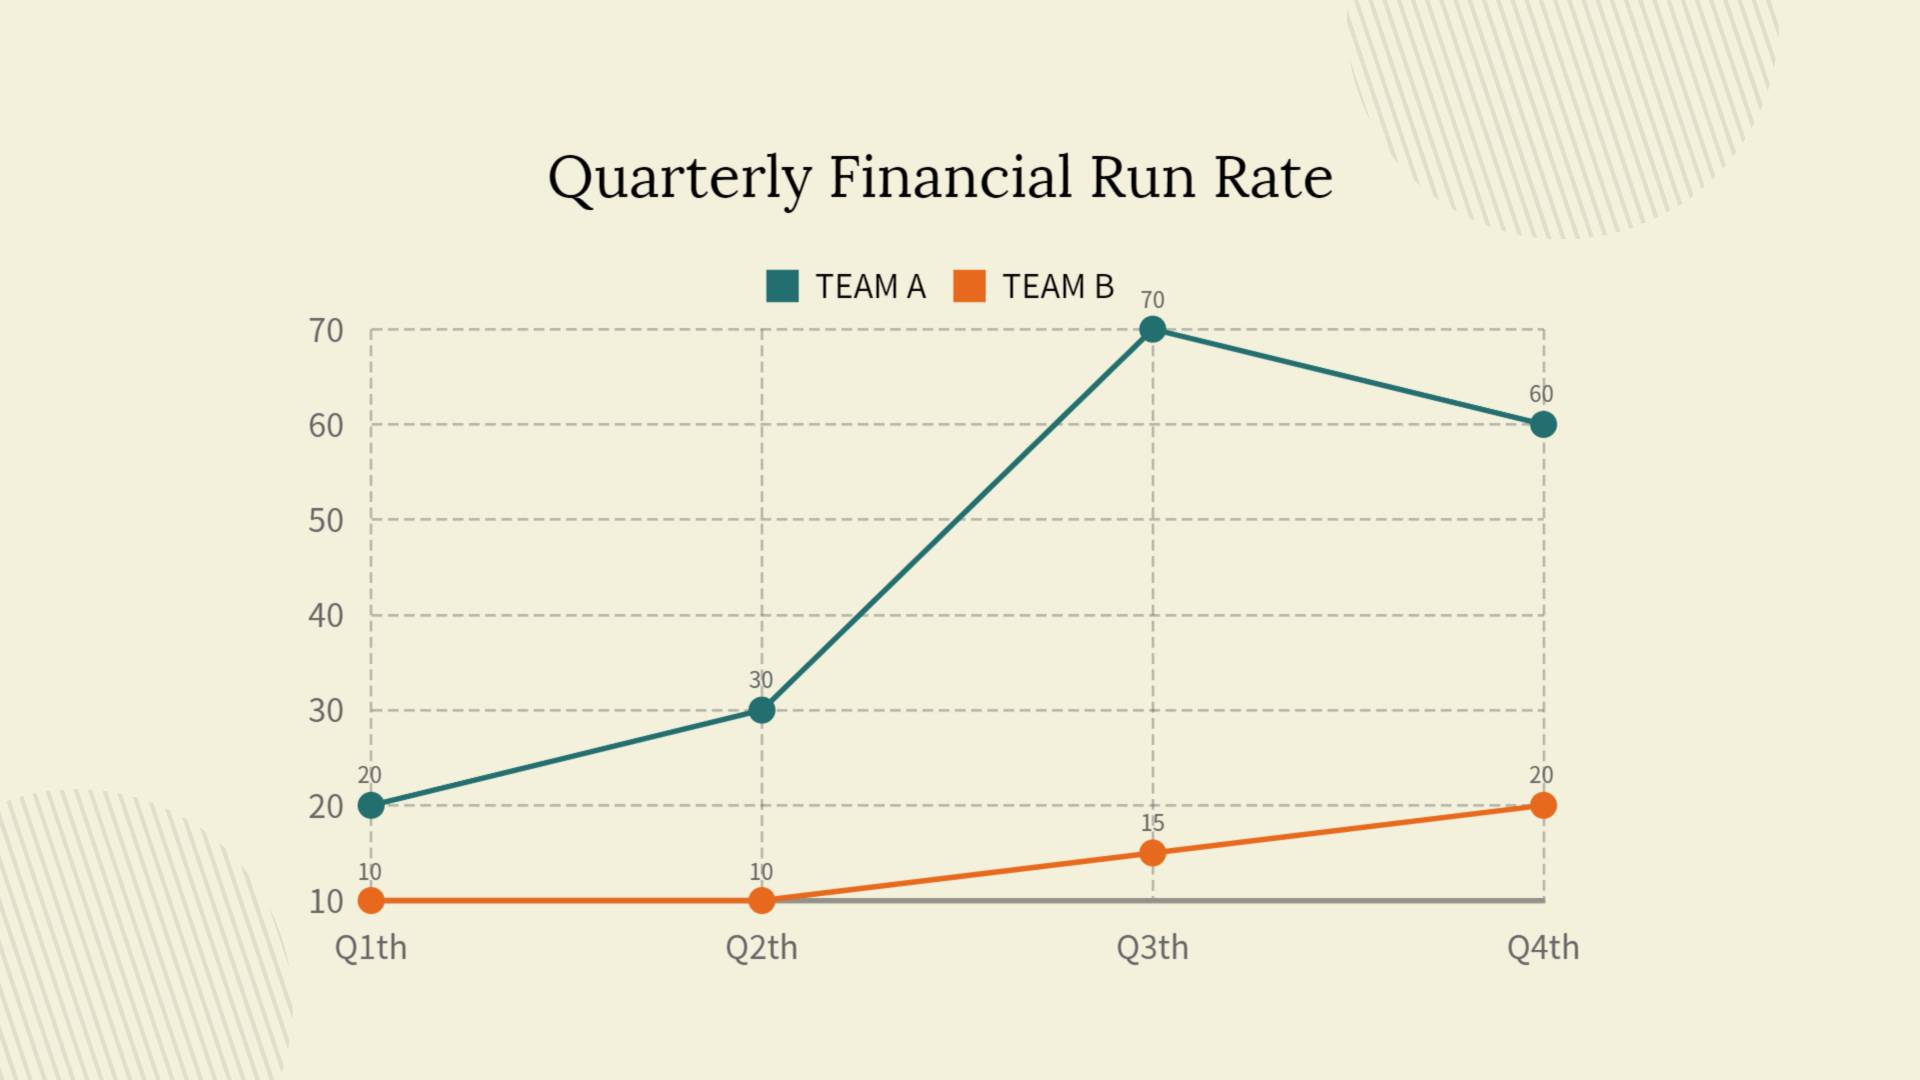
Easily Switch Between Graph Types for the Best Presentation
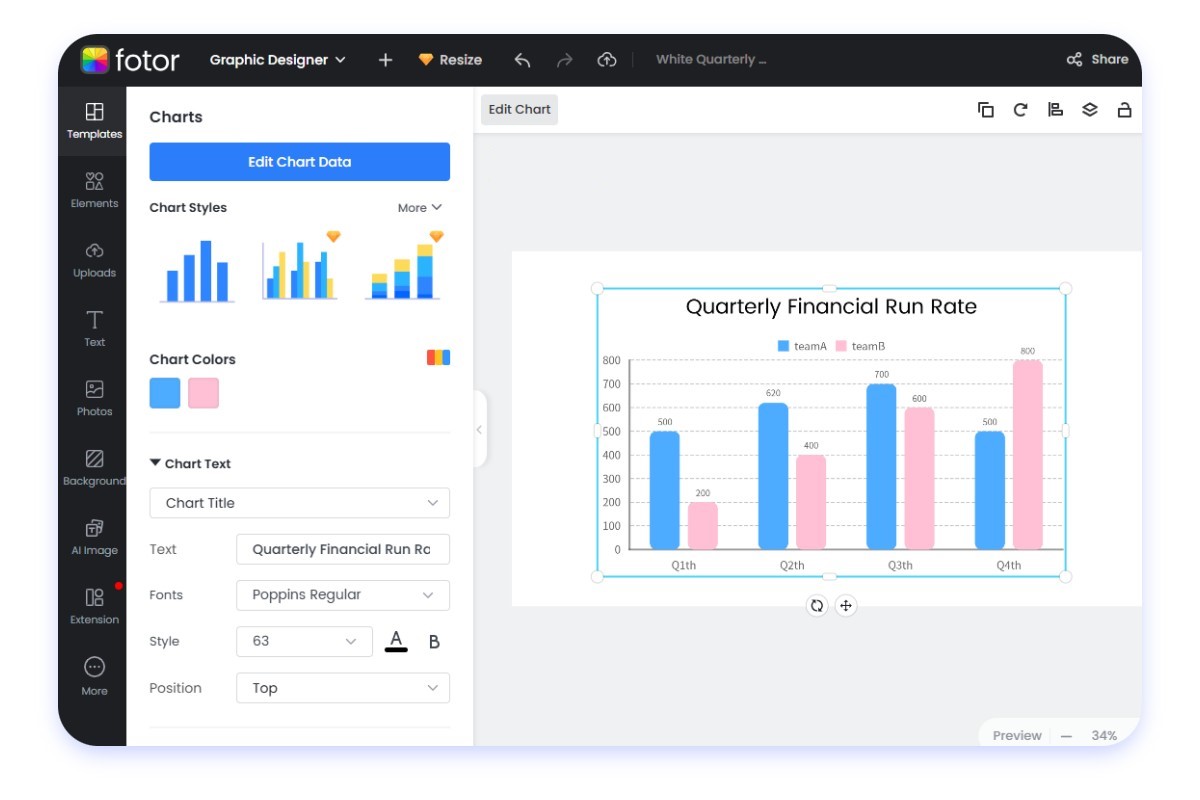
Create bar graphs, line charts, pie diagrams, area graphs, and everything with Fotor's online graph generator. On the left of the tool menu is our chart bar. Simply click the chart you like, and you can switch between different chart templates. You can easily find the type of chart that works best for your data. Once done, you can export the chart directly to form your data analysis report.
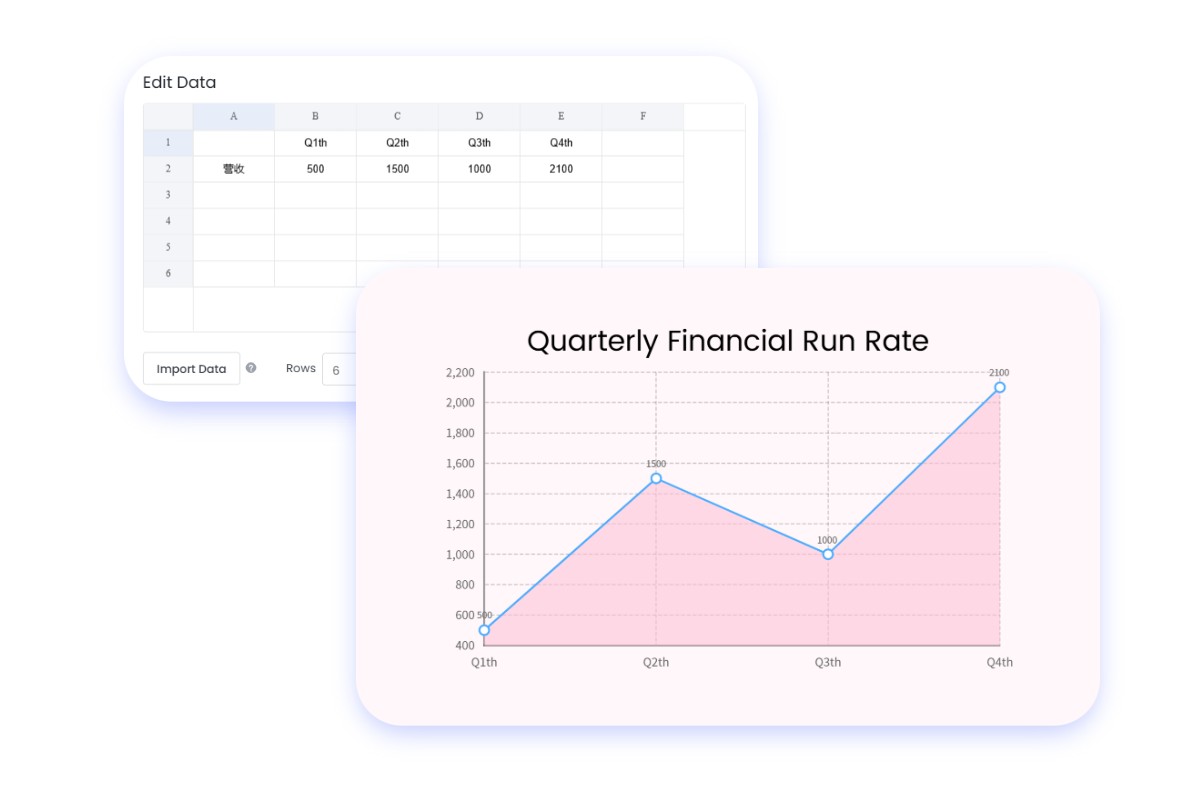
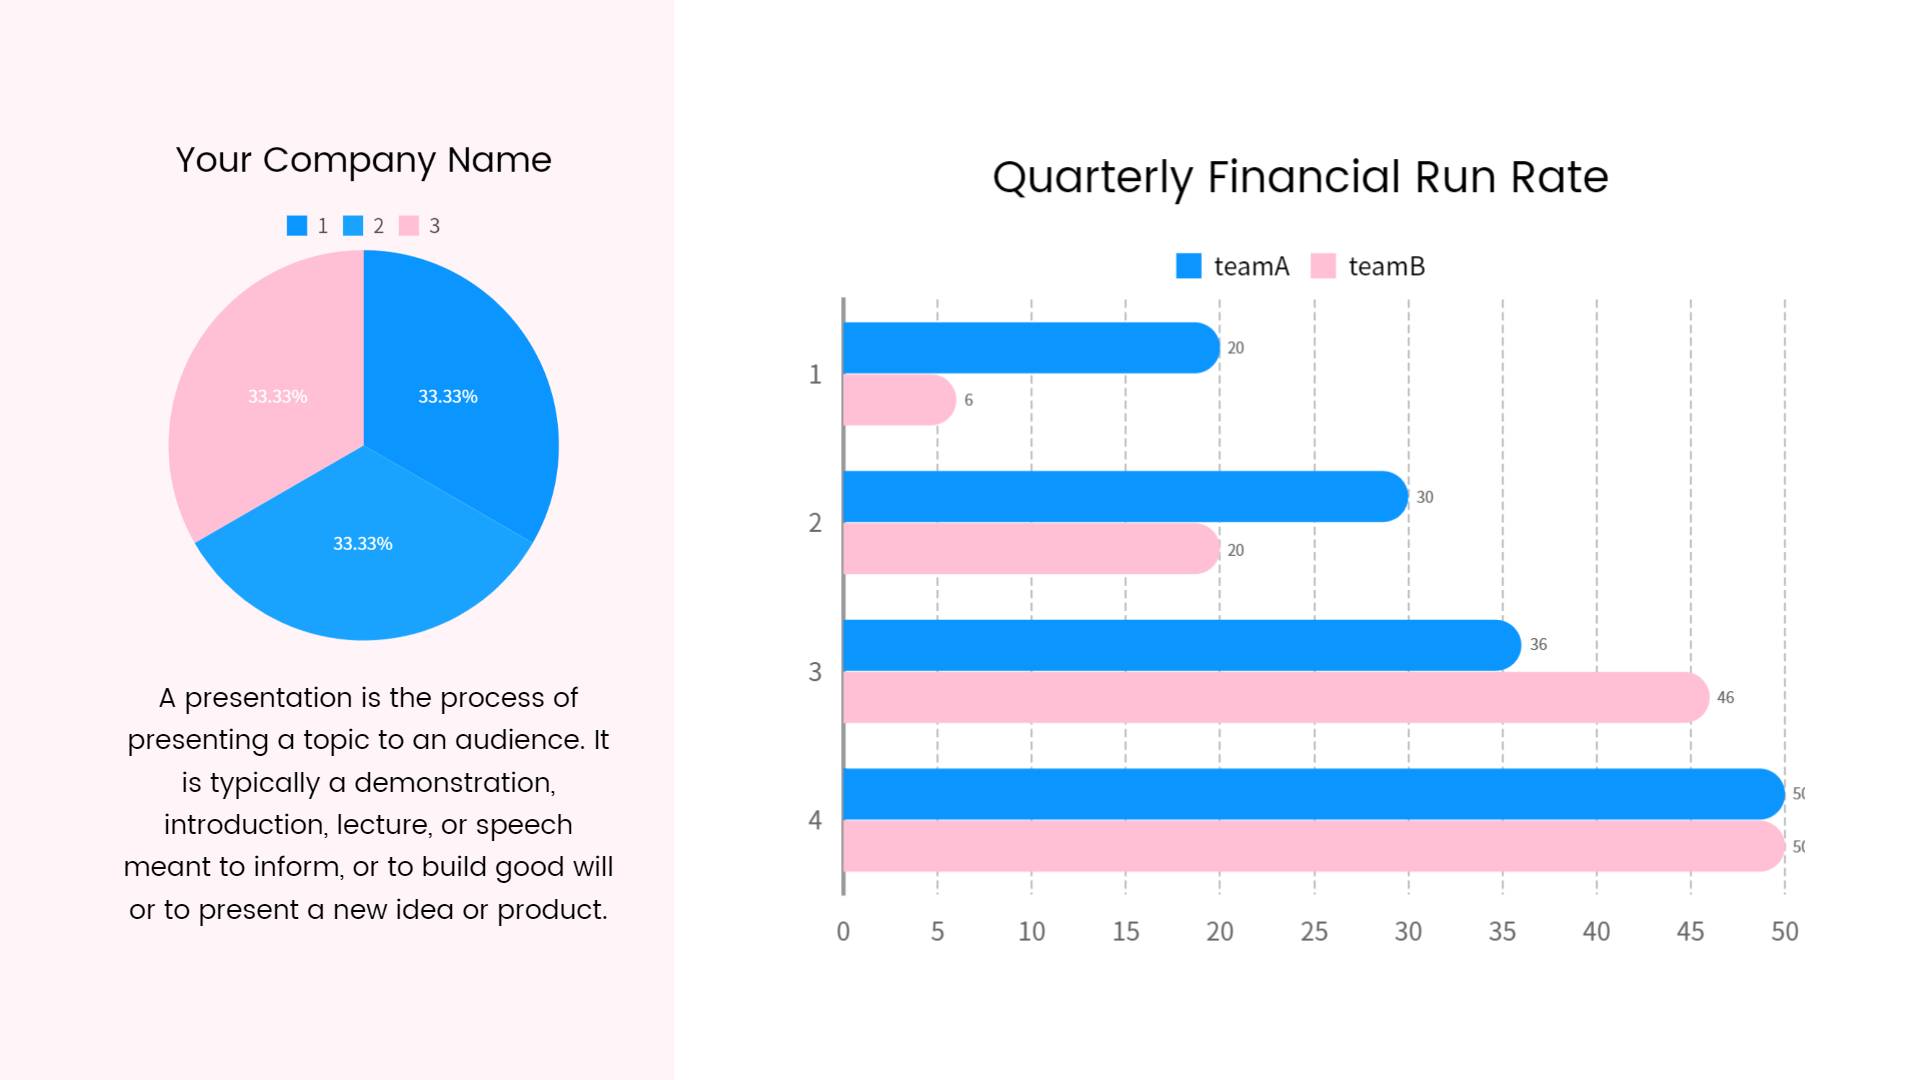
Instant Data Visualization in Fotor Graph Creator
Based on your data, Fotor's free graph maker works like a math calculator to generate streamlined data in clicks. After selecting the chart template and style you want, click on the "Edit Chart Data" button on the left top menu. You can enter your X-axis and Y-axis related data manually or import an Excel or Google Sheet. Fotor's graph creator will convert your data into a well-organized diagram automatically.
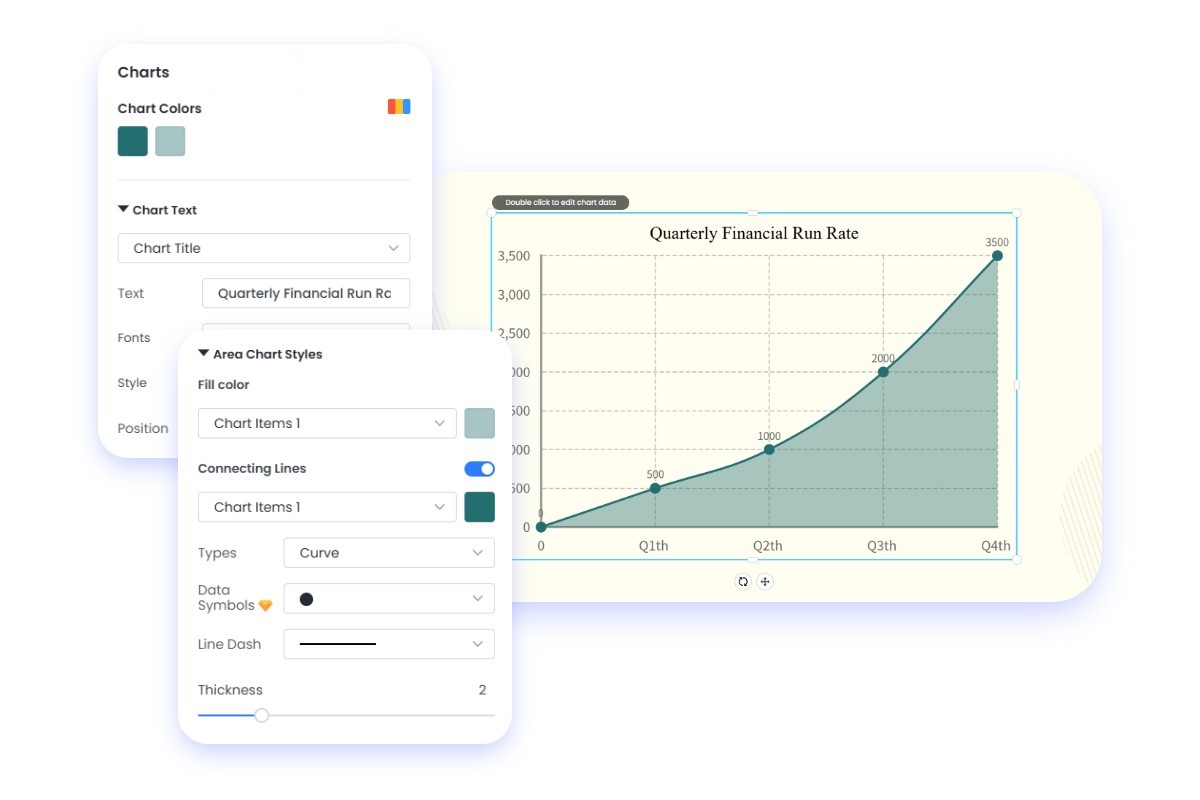
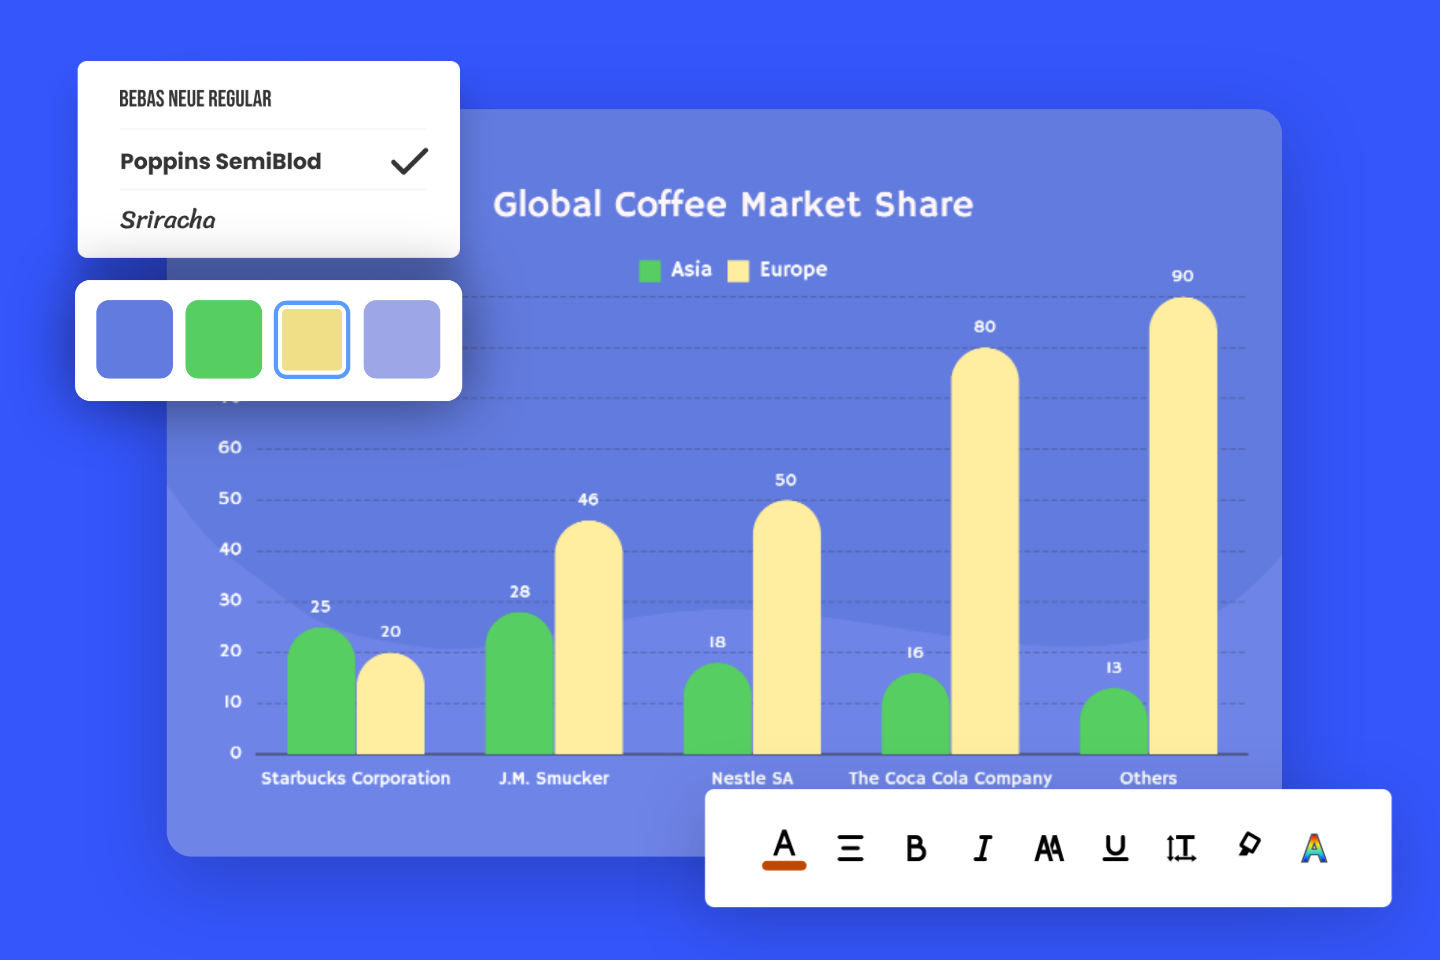
Custom Graph Maker for Personalized Brand Designs
Fotor chart maker allows you to adjust the graph design according to your taste or in line with the brand identity. You can get a logical set of custom graph-making experiences. Enjoy the maximum flexibility to customize your diagram designs from chart types to design details. You can change the chart colors, text descriptions, fonts, text position, data symbols, axis and grid lines, and more. Beautiful charts are at your fingertips with Fotor.
Embed Diagrams into Presentations or Any Report
Fotor is not only an online chart maker but is also available for other material designs, like presentations, flyers, posters, and more. You can effortlessly create graphs online and embed them into any design. Fotor's available for high-resolution download in a variety of formats, covering PNG, JPG, and PDF. In addition, you can share your chart design as a link with the public. So, create graphs online and download the designs you have created for free easily with Fotor.
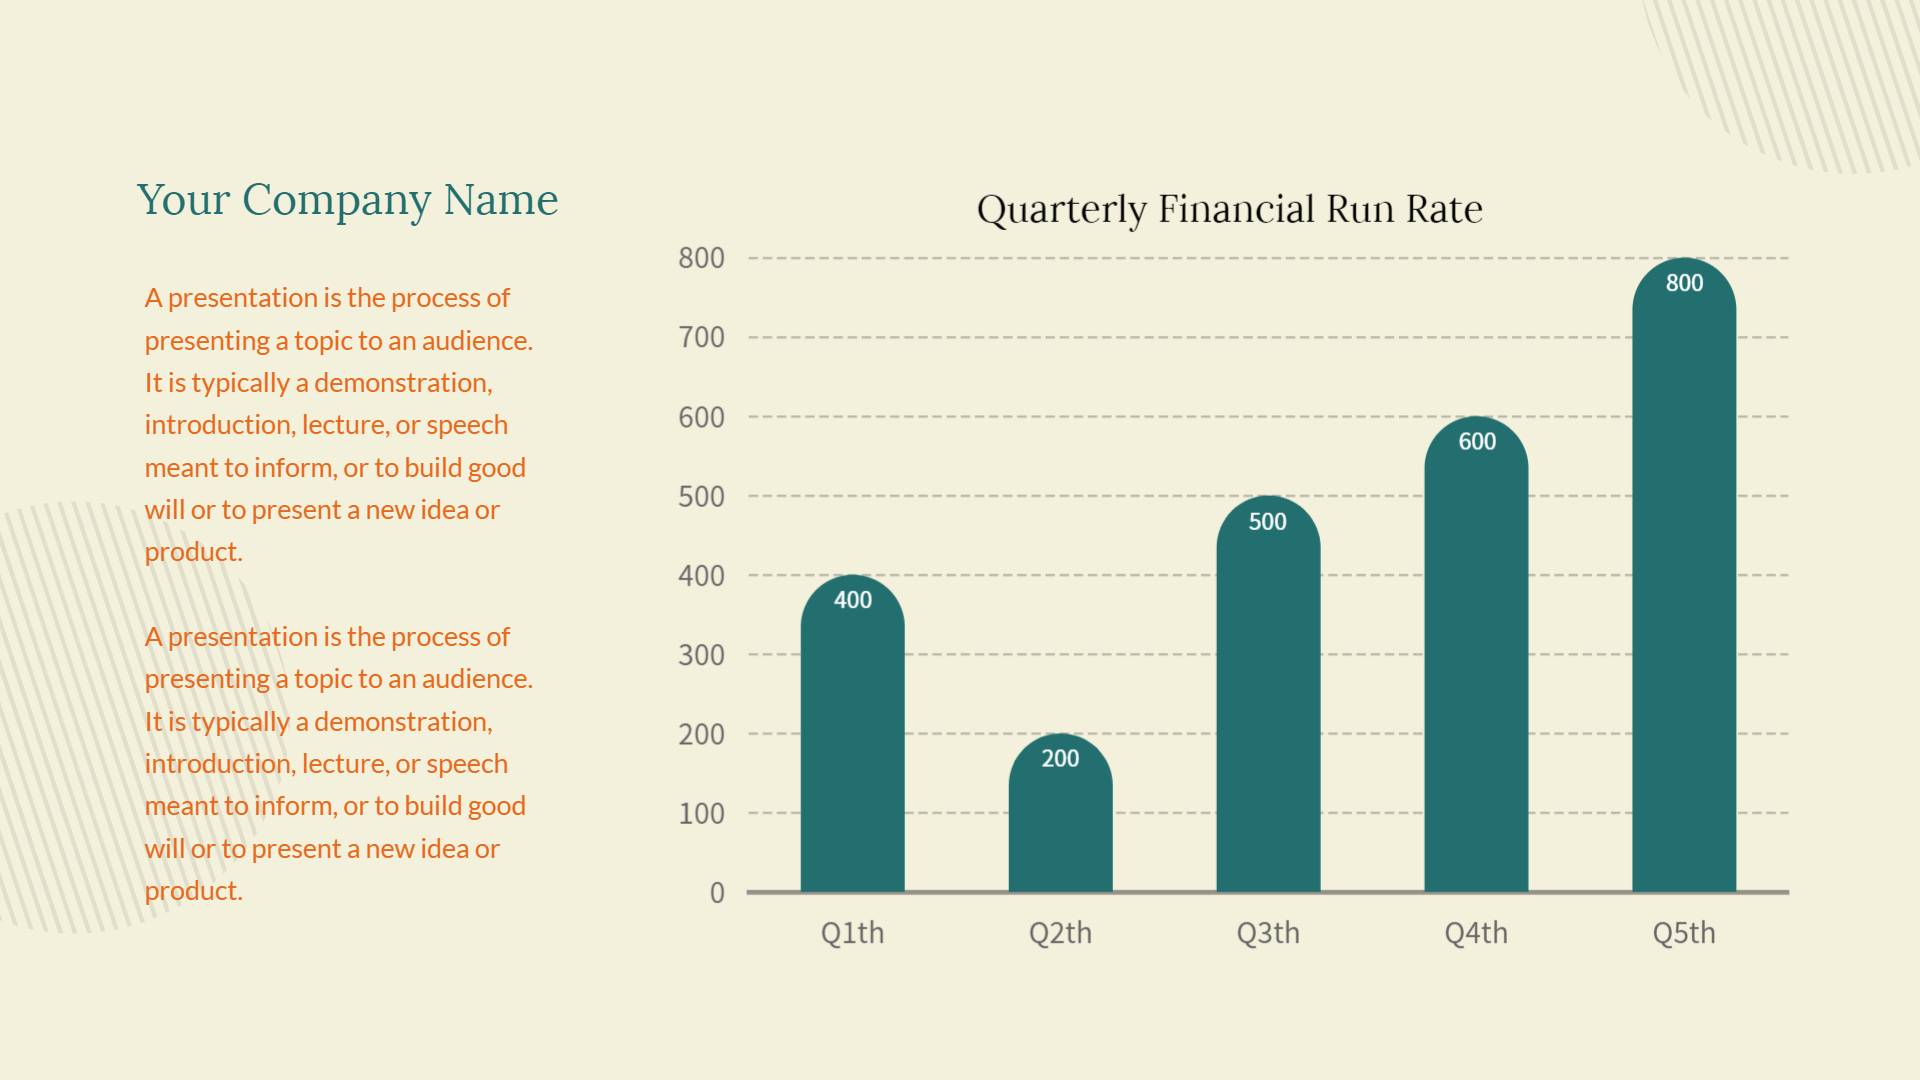
Graph Templates for Bar, Line, Pie Charts, and More
You can easily get started from scratch with our well-categorized chart styles, or streamline your workflow by selecting from the following professionally-designed chart templates. Make a graph immediately and employ our extensive customization options to enhance your data visualization effect!


How to Create Graphs Online for Free
- Click the "Make a Graph Now" button to get started.
- Find the "Charts" in the left menu bar, and you can see various charts there. Pick up any chart you want and click "Edit Chart Data" to personalize your chart.
- Enter all your datasets directly or just import your local files. Then Fotor's online graph maker will automatically process your data into the matching graphs and charts.
- Customize your free graph online by adjusting the color, text fonts, sizes, visuals, and more.
- Download your graphs for free in PNG, JPG, or PDF formats, or share them as links. Embed them in your presentations or reports if needed.
Great Features of Fotor Chart Maker
Professional Templates
Select from a wide range of professionally designed templates and resources. Make your online graphs more visually compelling.
Various Styles of Graphs
Switch between a series of chart styles with our all-in-one horizontal bar/column graph maker, pie/circle chart maker, line graph generator, and area diagram generator. Change graph types as desired.
One-click Download & Share
After editing your chart, download it easily in PDF, PNG, or JPG formats for free without watermarks. Or you can share the graph via a link for one-click access.
Custom Text Brand Style
In Fotor's easy data graph maker, you can customize the text, fonts, text position, size, chart color schemes, and more. You can also choose styles and upload a font of your own that fit your brand.

Easy Graph Making
With a user-friendly interface and intuitive tools, you can make a graph in a few clicks. Simply select a chart type, customize its data and style, and you can get an automatically-organized chart in seconds.